


The basic idea is:
For each point p of the set
Start with a complex number of value z =0 + j0.
Put z in the square
Add the complex value of the current point of the set to z Repeat the last 2 steps until the length of z becomes bigger than 2 or a maximum number of iterations has been done.
Then set the colour of the actual point to black if the maximum number of iterations was exceeded or according to a colour scheme if maximum number of iterations was not exceeded.
Now as
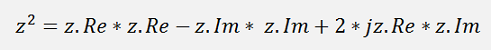
it's

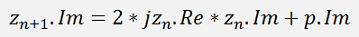
For the loop
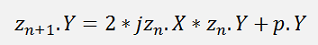
And if we use (x; y) points instead of complex numbers, it's:

Implemented in a small C# function that returns the number of done loops for a certain point:
public int IterationsLoop(System.Windows.Point p)
{
System.Windows.Point z = new System.Windows.Point(0, 0);
int i;
double xtemp;
for (i = 0; i <= maxIterations; i++)
{
xtemp = z.X * z.X - z.Y * z.Y + p.X;
z.Y = 2 * z.X * z.Y + p.Y;
z.X = xtemp;
if (z.X * z.X + z.Y * z.Y > 4)
break;
}
return i;
}
Quite a simple thing
To plot the picture with xSize, ySize the following sequence is used
CreatePic();
for (int y = 0; y < fractal.ySize; y++)
{
for (int x = 0; x < fractal.xSize; x++)
{
bmpDest.SetPixel(x, y, fractal.SetColorRGB(x, y));
}
}
With the function CreatePic() to compute the number of iterantions for each pixel of the picture and store it in the 2 dimensional array interations[x, y]:
public void CreatePic()
{
System.Windows.Point Z = new System.Windows.Point();
for (int x = 0; x < xSize; x++)
{
for (int y = 0; y < ySize; y++)
{
Z= ScreenToMB(x, y);
int i = IterationsLoop(Z);
iterations[x, y] = i;
}
}
}
With
public System.Windows.Point ScreenToMB(int xScreen, int yScreen)
{
System.Windows.Point ReturnVal = new System.Windows.Point();
ReturnVal.X = minX + (maxX - minX) * xScreen / xSize;
ReturnVal.Y = minY + (maxY - minY) * yScreen / ySize;
return ReturnVal;
}
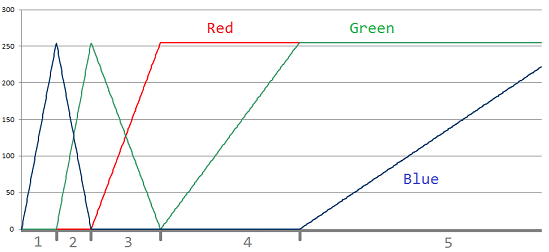
For the colour setting the target is to have a as wide variety of colours in the resulting graphic as possible. For each point there is a number of iterations carried out with the above function. According to this number of iterations a colour shall be chosen. As this number of iterations is limited to maxIterations, this limit can be used. I divided this maxIterations into 5 sections where the colours red, green or blue are varied like
The C# function for this looks like:
public Color SetColorRGB(int x, int y)
{
double colorPart1 = maxIterations / 15.0;
double colorPart2 = 2.0 * colorPart1;
double colorPart3 = 4.0 * colorPart1;
double colorPart4 = 8.0 * colorPart1;
Color pix;
int B;
int G;
int R;
if (iterations[x, y] >= maxIterations)
{
pix = Color.Black;
}
else
{
if (iterations[x, y] < colorPart1)
{
B = (int)(0xff * (iterations[x, y] / colorPart1));
G = 0;
R = 0;
}
else
{
if (iterations[x, y] < colorPart2)
{
B = 0xFF - (int)(0xff * ((iterations[x, y] - colorPart1) / colorPart1));
G = (int)(0xff * ((iterations[x, y] - colorPart1) / colorPart1));
R = 0;
}
else
{
if (iterations[x, y] < colorPart3)
{
B = 0;
G = 0xFF - (int)(0xff * ((iterations[x, y] - colorPart2) / colorPart2));
R = (int)(0xff * ((iterations[x, y] - colorPart2) / colorPart2));
}
else
{
if (iterations[x, y] < colorPart4)
{
B = 0;
G = (int)(0xff * ((iterations[x, y] - colorPart3) / colorPart3));
R = 0xff;
}
else
{
B = (int)(0xff * ((iterations[x, y] - colorPart4) / colorPart4));
G = 0xff;
R = 0xff;
}
}
}
}
if (R < 0)
R = 0;
else if (R > 255)
R = 255;
if (G < 0)
G = 0;
else if (G > 255)
G = 255;
if (B < 0)
B = 0;
else if (B > 255)
B = 255;
pix = Color.FromArgb(R, G, B);
}
return pix;
}
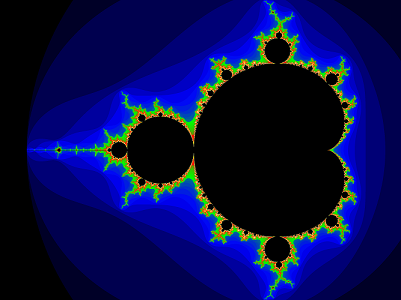
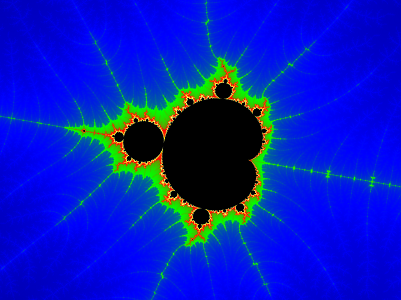
With this colour setting and a range for x of -2.2 to 0.8 and for y of -1.1 to 1.1 and maxIterations = 200 we get quite a nice graphic:
But it becomes really fascinating if we zoom out a bit:
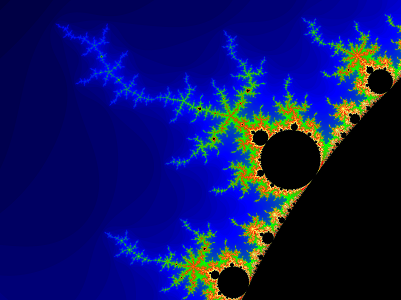
And now there is a little black dot (in the white rectangle):

If this is zoomed out, there is another similar dot and this zoomed oud out shows the same again… and 2.5 mio times zoomed out with the setting
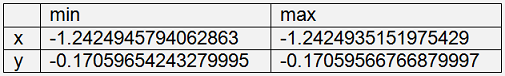
and maxIterations = 15000 the same shape appears as was in the beginning:
and with
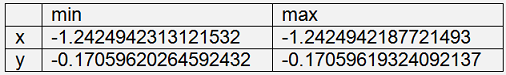
What makes a 230 mio times zoom, maxiterations = 50000 and 1.5 h computation time
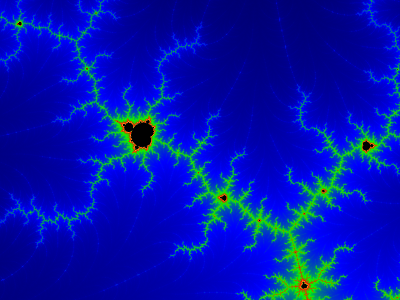
There are 1000 of this shapes in the plot. Isn’t that amazing? That’s makes mathematics so fascinating and beautiful
The demo project consists of one main window:
Here's a little video with animated zooming deep into the image.
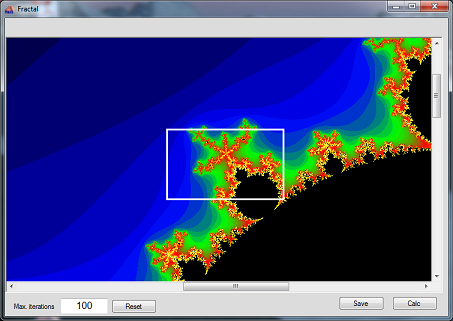
Pressing the <Calc> button computes and plots the Mandelbrot set.
There is a zoom function implemented. Pressing the left mouse button and moving from top, left to bottom, right marks a zoom area by a white rectangle. Pressing <Calc> afterwards computes and plots the Mandelbrot set with this zoom setting. Pressing the right mouse button resets the current zoom.
Pressing the <Reset> button resets the zoom to the initial setting.
Pressing the <Save> button saves the current plot into the file “Fractal.png” in the application directory of this application
C# Demo Project Mandelbrot