Clustering data is a widely known approach to classify data in machine learning. A quite simple algorithm for this is the K-means algorithm.
To cluster a distribution of data like:
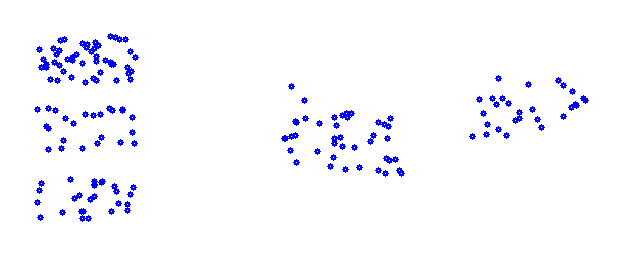
That contains 5 clusters, the K-means algorithm starts with the definition of a random center point for each cluster to be computed. For the above data that could be the red points.
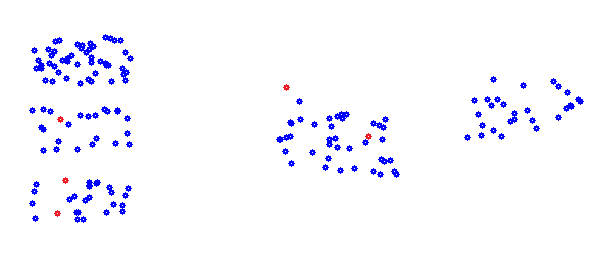
For a first step random selected data points can be used for that. O.k. The selection in the above picture is not the best (just random points). But that’s not important for the beginning.
Now for each data point the nearest center point must be found and the data point is assigned to the cluster of this center point. When all data points are assigned to a cluster, for each cluster the center must be determined and the center point of the cluster is set to this. With these new center points the procedure starts again. That means that all the elements of the clusters are removed again and for each data point the nearest center point is searched again and the data point is assigned the cluster of the nearest center point again. That would look like:
public void DoCluster()
{
int i, j, k;
int nearest;
for (k = 0; k < 30; k++)
{
for (i = 0; i < cluster.Count; i++) // clear all clusters
{
cluster[i].Clear();
}
for (i = 0; i < samples; i++) // assign each sample to nearest cluster
{
nearest = find_nearest(cluster, data.values.ElementAt(i));
if (nearest < cluster.Count)
cluster[nearest].dataPoint.Add(data.values.ElementAt(i));
}
for (i = 0; i < cluster.Count; i++) // compute new center points
{
double[] b = calcBalancePoint(cluster[i].dataPoint);
for (j = 0; j < features; j++)
{
cluster[i].centerPoint[j] = b[j];
}
}
}
}
With
int find_nearest(Collection<Cluster> cluster, double[] x)
{
int i, j;
int actPos = 0;
double actMin = 100000;
double actDist;
double[] actPoint = new double[features];
for (i = 0; i < cluster.Count; i++)
{
for (j = 0; j < features; j++)
actPoint[j] = cluster[i].centerPoint[j];
actDist = CalcDist(actPoint, x);
if (actDist < actMin)
{
actMin = actDist;
actPos = i;
}
}
return actPos;
}
and
double CalcDist(double[] x1, double[] x2)
{
int i;
double res = 0;
for (i = 0; i < x2.Length; i++)
{
res = res + (x1[i] - x2[i]) * (x1[i] - x2[i]);
}
return Math.Sqrt(res);
}
and
double[] calcBalancePoint(Collection<double[]> values)
{
int i, j;
double[] result = new double[features];
double[] sample;
for (i = 0; i < values.Count; i++)
{
sample = values.ElementAt(i);
for (j = 0; j < features; j++)
{
result[j] = result[j] + sample[j];
}
}
if (values.Count > 0)
{
for (j = 0; j < features; j++)
{
result[j] = result[j] / values.Count;
}
}
return result;
}
and the class
public class Cluster
{
public Collection<double[]> dataPoint;
public double[] centerPoint;
public Cluster(int features)
{
dataPoint = new Collection<double[]>();
centerPoint = new double[features];
}
}
It is initialized in a collection:
Collection<Cluster> cluster = new Collection<Cluster>();
As a little note: The variable features is the number of elements of a data point to be taken into account for the clustering. It is not always equal to the number of elements the data point contains. The function DoCluster moves the center points and the cluster step by step to a better position were the clustering becomes better and better. Until the center points do not move anymore and the clustering is at its current optimum. But of course this optimum is not for sure the all-out best solution. With the above starting center points the final clustering would be far from optimal. The algorithm does not converge to the all-out optimum for sure. That depends strongly on the start conditions. Therefore the entire procedure should be carried out for several times with different start setting of the center points and the result of each run should be compared to each other run to find the best solution. For one of the runs with the samples above the setting of the center points could be
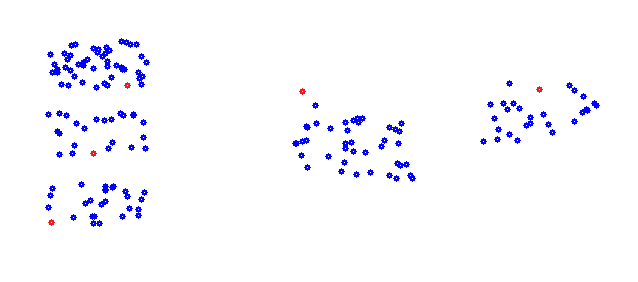
And with these the clustering would be the optimum:
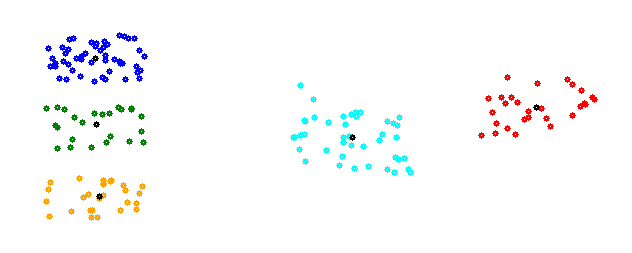
With the final center points in black and the clusters in colours
Now the question is how to determine which solution is the best. Therefore the so called Inertia can be used.
The Inertia is the mean squared distance of each data sample to its center point like:
double CalcInertia()
{
double res = 0;
int i, j, k;
double[] tempEl = new double[features];
double[] tempCenter = new double[features];
double tempSum = 0;
if (data.values.Count > 0)
{
for (i = 0; i < cluster.Count; i++)
{
tempCenter = cluster[i].centerPoint;
for (j = 0; j < cluster[i].dataPoint.Count; j++)
{
tempEl = cluster[i].dataPoint.ElementAt(j);
tempSum = 0;
for (k = 0; k < features; k++)
tempSum += (tempEl[k] - tempCenter[k]) * (tempEl[k] - tempCenter[k]);
res += tempSum;
}
}
res = res / data.values.Count;
}
return res;
}
This Inertia is the lower the better the clustering is.
For the best clustering of the above samples it is 0.41341.
So the procedure is to carry out the clustering with some starting center points in a repeating loop. For each loop the center points shall be kept and after clustering check if the achieved Inertia is the lower than the one of the last loop. If it is lower, save the actual Inertia and the used starting center points. After a certain number of loops the best solution might have been found and in a last run carry out the clustering with the saved starting center points. That will be the optimal solution

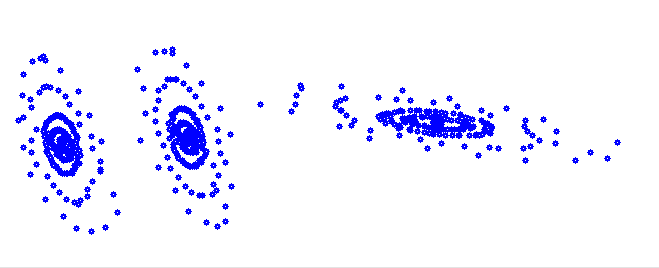
The K-means algorithm works quite well, if the data to be clustered is separated in dense, more or less round clusters. But data like this
It would cluster like
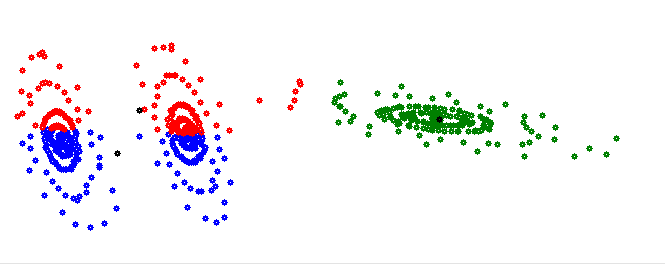
With the center points for the red and blue cluster outside of the cluster. That’s not useful.
This data contains 3 gaussian distributions in 2 dimensions and for such data the Gaussian mixture model is the better approach.
The Gaussian mixture model handles data which is normally distributed in more than one dimension. For the 2 dimensional case that would look like:
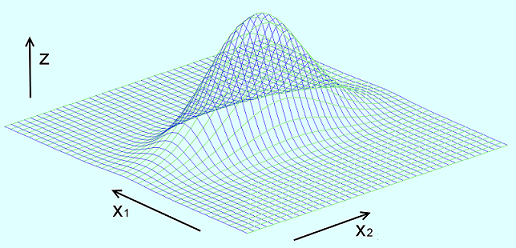
With one Gaussian distribution in x1 direction, one in x2 direction and their probability distribution in z direction (in some articles about the Gaussian mixture model they show 2 Gaussian distributions beside each other in one dimension. I say that’s wrong and has nothing to do with the Gaussian mixture model
 ).
).The probability distribution function p(x) for the Gaussian distribution in one dimension is:

With
For 2 dimensions x1 and x2 with normally distributions exactly in the directions of the axis x1 and x2 like
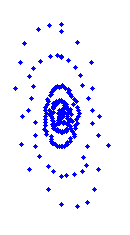
the probability function is:

This can be written as:

and if the formulation in the exponential function is written in a matrix form, that would be

Or a bit more separated

And as
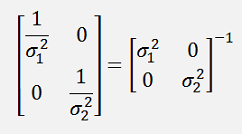

Now there is a cool step for σ1* σ2:

and with this:

The matrix

Is basically a Covariance matrix of the squared standard deviations.

As long as the distributions are exactly in x1 and x2 direction this Covariance matrix is a diagonal matrix. But it the distributions are inclined, the Covariance matrix is no more diagonal matrix (and the derivation becomes much more complicate
 ). With this we have the complete
formulation for Gaussian mixture model for 2 dimensions:
With ∑ as the covariance matrix of σ and |∑| the determinant of it (to compute the determinant of a matrix see Matrix determinant and Cramers method). This formulation can easily be extended to more dimensions. The function CalcCovariance computes Covariance matrix.
public void CalcCovariance(Collection<double[]> data)
{
int i, x, y;
double res = 0;
for (y = 0; y < features; y++)
{
for (x = y; x < features; x++)
{
res = 0;
for (i = 0; i < data.Count; i++)
{
res += (data.ElementAt(i)[x] - centerPoint[x]) * (data.ElementAt(i)[y] - centerPoint[y]);
}
sigma[x, y] = (res / data.Count);
}
}
for (y = 0; y < features-1; y++)
{
for (x = y+1; x < features; x++)
{
sigma[y, x] = sigma[x, y];
}
}
}
And as the inverted matrix of σ is required as well
public void InvertSigma()
{
invSigma = Collection.Invert(sigma, features);
}
(For the inverting of a Matrix see Inverse of a square Matrix)
Both functions are in the class Cluster:
public class Cluster
{
public Collection<double[]> dataPoint;
public double[] centerPoint;
public double[,] sigma;
public double[,] invSigma;
int features;
With this covariance matrix and it’s inverted the probability whether a certain data point belongs to a certain cluster.
public double CalcP(double[] data)
{
int i;
double res = 0;
double[] tempVect = new double[features];
tempVect = Matrix.Mult(data, invSigma);
for (i = 0; i < features; i++)
res += tempVect[i] * data[i];
return System.Math.Exp(-res / 2) / System.Math.Sqrt(Matrix.CalcDet(sigma, features));
}
The procedure for clustering is similar to the procedure in the K-means algorithm: Define the center points of the clusters, assign the data points to the clusters, compute the new center points of the built clusters and repeat until the clusters are optimal. In the popular literature even the starting with random generated center points is similar to the one in the K-means algorithm. But I follow a different approach. I’m not too happy with random things. So my idea is to start with just 2 clusters. I divide the data into 2 clusters. Then I try to divide each of these clusters into 2 new clusters and repeat this procedure until there are enough clusters built. As starting center points I search for the 2 data points that are the furthest away from each other. Therefor the center point of the data is searched. From this the furthest point is searched and taken as the first center point. From this first center point the furthest point is then used as the second center point. Of course not every cluster can be divided into 2 new clusters. To determine whether the division is good or not I use the fact that the division of a normally distributed data set does not yield 2 new normally distributed clusters.
By the division of such a cluster
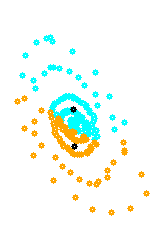
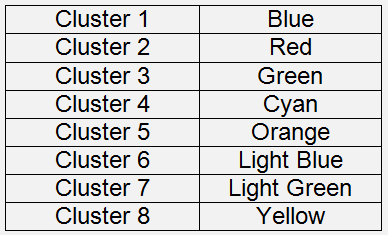
the normally distribution of both new clusters becomes distorted (as shown in the above picture). This distortion can be seen in the probability of one center point in relation to the other cluster. If both clusters would be normally distributed, the probability that the center point of one cluster belongs to the other cluster is quite small. If the distribution is distorted as in the above picture, the probability that the center point of the light blue cluster belongs to the yellow cluster can become much bigger than 0 and that’s a clear evidence that the division of this cluster is not good and should be discarded.
With this approach the clustering function to build 2 possible clusters looks like:
bool DoCluster(Collection<double[]> dataPoint, bool active = true)
{
int i, j, k, l;
int bestFit = 0;
double maxProp = -1e30;
double actProp1;
double actProp2;
double[] x = new double[features];
double[] vect = new double[features];
Collection<Cluster> localCluster = new Collection<Cluster>();
localCluster.Add(new Cluster(features));
localCluster.Add(new Cluster(features));
x = CalcBalancePoint(dataPoint);
for(j=0; j < features; j++)
localCluster[0].centerPoint[j] = x[j];
i = FindFurthest(localCluster, dataPoint);
for (j = 0; j < features; j++)
localCluster[0].centerPoint[j] = dataPoint.ElementAt(i)[j];
i = FindFurthest(localCluster, dataPoint);
for (j = 0; j < features; j++)
localCluster[1].centerPoint[j] = dataPoint.ElementAt(i)[j];
if (active)
{
for (k = 0; k < 40; k++)
{
for (i = 0; i < localCluster.Count; i++)
{
localCluster[i].Clear();
}
for (i = 0; i < dataPoint.Count; i++)
{
x = dataPoint.ElementAt(i);
maxProp = -1e30;
for (j = 0; j < localCluster.Count; j++)
{
for (l = 0; l < features; l++)
vect[l] = x[l] - localCluster[j].centerPoint[l];
actProp1 = localCluster[j].CalcP(vect);
if (actProp1 > maxProp)
{
bestFit = j;
maxProp = actProp1;
}
}
if (bestFit < localCluster.Count)
localCluster[bestFit].dataPoint.Add(x);
}
for (i = 0; i < localCluster.Count; i++)
{
double[] b = CalcBalancePoint(localCluster[i].dataPoint);
for (j = 0; j < features; j++)
{
localCluster[i].centerPoint[j] = b[j];
}
localCluster[i].CalcCovariance(localCluster[i].dataPoint);
localCluster[i].InvertSigma();
}
}
}
for (l = 0; l < features; l++)
vect[l] = (localCluster[0].centerPoint[l] - localCluster[1].centerPoint[l]);
actProp1 = localCluster[1].CalcP(vect);
for (l = 0; l < features; l++)
vect[l] = (localCluster[1].centerPoint[l] - localCluster[0].centerPoint[l]);
actProp2 = localCluster[0].CalcP(vect);
if (((actProp1 < 0.1) && (actProp2 < 0.1)) && (cluster.Count < NBOFCLUSTERS))
{
cluster.Add(localCluster[0]);
cluster.Add(localCluster[1]);
return true;
}
else
return false;
}
}
This function returns true if the current cluster or data set was successful divided into 2 new clusters. In this case the current cluster, that was just divided into 2 new clusters, must be deleted from the list of clusters afterwards. Therefor the function call should be:
while (notDone && (count < 10))
{
count++;
notDone = false;
nbOfClusters = cluster.Count;
for (i = nbOfClusters-1; i >= 0; i--)
{
if (DoCluster(cluster.ElementAt(i).dataPoint))
{
cluster.Remove(cluster.ElementAt(i));
notDone = true;
}
}
}
The advantage of this approach is, that it generates not more clusters than the optimal number

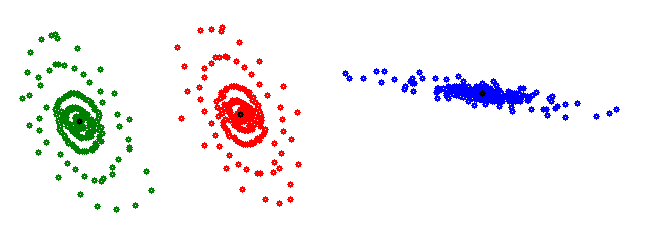
The sample data is clustered perfect now
O.k. so far there were only 2 dimensions the algorithm had to deal with. Now let’s try some more complicate data samples (at least a little more complex
 ):
): The Iris data set is my favorite. It contains the data of 150 Iris flowers consisting of the 4 features petal length and width and sepal length and width and the flower class. And the algorithm shall build one cluster for each flower class. That means 3 clusters shall be built and 4 features shall be taken into account. (For the Iris flowers Logistic Regression with the sigmoid function)
After clustering the graphic plot in my sample application looks like:
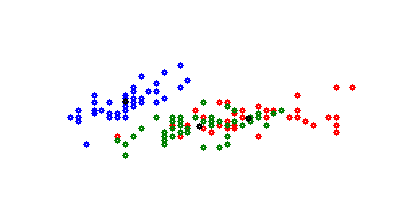
That’s possibly a bit confusing. But this plot shows only 2 of 4 dimensions. If dimension 3 and 4 is plotted, its:
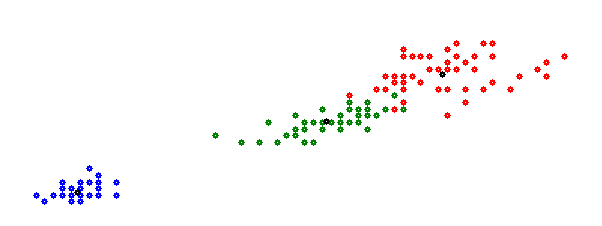
That looks a little better. But still not the one. With more than 2 dimensions (or features) the plot is no more usable. It’s better to save each cluster in a separate CSV file. There the result can be seen much better. With this we can see that in the first cluster all flowers of class 1 are placed which is the Iris Setosa. In the second cluster the first 2 samples are Iris Versicolour (class 2) and all the others are Iris Virginica (class 3) and in the third cluster the last sample is Iris Virginica and all the others are Iris Versicolour. That’s not perfect, but quite o.k.
 As there
are only 150 samples, the data might not be distributed to well
Gaussian. Therefore the clustering might not be perfect.
As there
are only 150 samples, the data might not be distributed to well
Gaussian. Therefore the clustering might not be perfect.Finally it must be said: But algorithms are for sure quite cool. But they are quite sensitive on distortions and if there are many dimensions and therefor many features to be taken into account, it might become very difficult to build really useful clusters.
There is a sample project for the K-means and one for the Gaussian multy model. They both consist of one main window with 2 taps. The first tap displays the data and the second one shows a plot of the data before and after clustering.
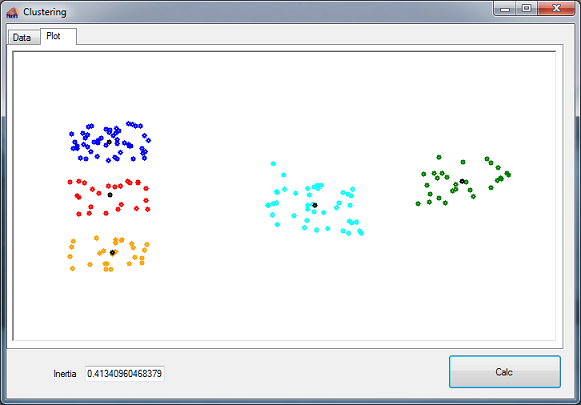
The data to cluster is in a CSV file included in the project.

